Authors D. Nicoletti1, J.Y. Soulard, J. Schmidt, A. Kokolekos
This paper was presented at Corrosion & Prevention 2023.
ABSTRACT
Many microorganisms present in oil and gas systems are known to participate in microbiologically influenced corrosion (MIC), including sulfate-reducing prokaryotes (SRP), sulfur-oxidizing bacteria (SOB) and methanogens. As older oil wells are reopened in Europe for production to decrease foreign energy reliance, microbial mitigation strategies (chemical programs and pigging) are put in place to decrease the risk of MIC, souring, biofouling, and other costly microbial issues. Though bulk biomass can be managed by these mitigation strategies, it is valuable to understand whether MIC-implicated organisms are being mitigated sufficiently. In this work molecular microbiology methods quantitative polymerase chain reaction (qPCR) and next generation sequencing are used to investigate the impact of a chemical treatment on MIC- implicated organisms in a conventional oil recovery scenario. In this study, a 6 km steel pipeline with escalated corrosion rates that connects a well outlet and downstream separation machinery in a conventional oil recovery scenario was investigated for MIC risk by using a variety of microbial monitoring techniques including quantitative polymerase chain reaction (qPCR) and next generation sequencing (NGS). These molecular microbiological methods (MMM) were combined with ATP and culture bottle data to investigate biocide efficacy and MIC risk. NGS and qPCR data revealed an enrichment in SRP, and though methanogens were detected, qPCR revealed that the micH gene, a biomarker for corrosive methanogens, was not present. The four microbial monitoring methods were utilized to investigate the impact of two biocide trials for efficacy against overall bioburden and SRP as identified by qPCR and NGS.
Keywords: microbiologically-influenced corrosion (MIC), qPCR, ATP, Next Generation Sequencing (NGS), biocides
INTRODUCTION
Since the discovery of microbiologically-influenced corrosion (MIC) and other deleterious impacts of microbial growth in oil systems, the use of mitigative strategies such as biocide application has been implemented. Biocide programs often make up a substantial portion of operational expenditure in oil and gas recovery, and this cost can be enhanced when biocide programs are not optimized to avoid over- or under-dosing, or when a biocide program is not monitored for efficacy. These inefficiencies cannot be avoided if microbial monitoring techniques are not implemented to understand the microbial response to treatments.
The microorganisms that inhabit oil and gas infrastructure are diverse and participate in a broad array of metabolisms [1, 2, 3]. Additionally, different sites with different operating conditions can host different microbial community structures. For example, high temperature reservoirs can enrich thermophiles, and highly saline operating conditions can enrich for halophiles [4, 5]. Each of these operational conditions can also impact the biocide program to manage these organisms as there is not a “one-size-fits-all” product. Microbial monitoring to assess biocide efficacy has evolved over recent years away from the sole use of culture-dependant methods and towards culture-independent molecular microbiology methods (MMM) for more accurate data and faster feedback on mitigation programs.
Adenosine triphosphate (ATP) is an energy-carrying molecule present in all living cells and can be measured in a sample to understand active biomass in a sample in approximately 5 minutes. ATP measurement has been used for microbial monitoring in the oil and gas industry for a number of years and is included in standard test methods [6, 7]. Quantitative polymerase chain reaction (qPCR) is a gold standard molecular biology method for measuring the concentration of a particular gene-target in a sample. This gene target can be universal where the total prokaryotes, total bacteria, or total archaea can be measured, or it can be targeted to a particular metabolic group of interest. For example, the dissimilatory sulfite reductase gene present in sulfate-reducing bacteria (SRB) or the methyl coenzyme M reductase α-subunit (mcrA) gene present in methanogens, both groups of microorganisms particularly relevant to MIC, can be targeted with qPCR [8, 9]. qPCR is becoming a more common microbial monitoring method for identification and accurate quantification of problematic microorganisms in oilfield samples. Next generation sequencing (NGS) is a technology whereby the entire microbial community present in a sample is characterized by sequencing a region of the 16S rRNA gene. The result is a full taxonomic summary of the microorganisms present in a sample and their abundance relative to the total community. NGS is used for characterizing microbial communities in oilfield samples and its use has broadened the understanding of oilfield microbiology substantially since its uptake [4, 5, 10].
In this study, a conventional oil recovery site experiencing proliferating microbial growth in a particular stretch of pipeline in their operation connecting a well outlet and downstream separation machinery was investigated over two biocide trials. Over the course of these two trials, ATP, qPCR, and NGS technologies were utilized to understand the microbial response to the biocides used and identify the presence of MIC-associated microorganisms and metabolic groups to assess MIC risk.
METHODS AND MATERIALS
FIELD SITE AND SAMPLING
Figure 1 describes the sampling points monitored for microbial activity over the course of two biocide trials performed 4 months apart in a conventional oil recovery site. Biocide A trial was conducted in November 2022 and the Biocide B trial was conducted in April 2023. Sampling sites included produced water before and after a 6 km pipeline that transports produced fluids from well head to downstream separator machinery, water after the separator, and reinjection water. For each biocide trial, a batch was applied on Day 1 after a time zero sample was taken. For Biocide A, a second batch treatment was applied on Day 3.
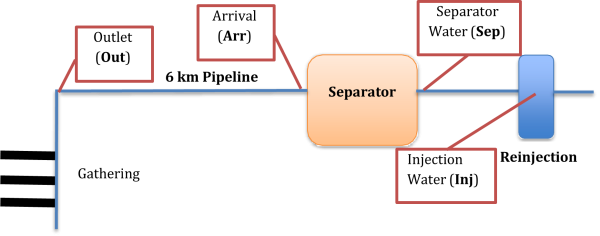
FIGURE 1: PROCESS FLOW DIAGRAM WITH SAMPLING POINTS OUTLINED IN RED.
MICROBIOLOGICAL MONITORING METHODS
Produced water was collected from each sampling point and a portion was used for ATP testing immediately upon sampling, and a second portion was preserved for qPCR and NGS. ATP concentration was determined using LuminUltra Technologies 2nd Generation ATP* test kits and luminometer. Samples were filtered to collect biomass and preserved onsite using LuminUltra Technologies GeneCount qKit* preservation kits to ensure the microbial communities present in the samples remains stable while the samples were shipped to the laboratory in Baltimore, MD where qPCR analysis and NGS were performed. qPCR assay targets included Total Prokaryote, Total Bacteria, Total Archaea, Methanogens, Sulfate-Reducing Bacteria (SRB), Sulfur-Oxidizing Bacteria (SOB), Iron-Reducing Bacteria (IRB), and corrosive methanogens (micH). Next Generation Sequencing was performed by sequencing the V4 variable region of the 16S rRNA gene, then running those sequences against the Silva 138 database for a full taxonomic summary of the microbial community in each sample by relative read abundance (%).
RESULTS
ATP
The comparative ATP results for Biocide A and B trials are shown in Figure 2. There was no noticeable decrease in ATP concentration as a response to Biocide A batch treatments after Day 1 and Day 3. There was a decrease in ATP concentration observed by Day 2 of the Biocide B trial. Generally, the pipe arrival samples had higher ATP than the well outlet samples by at minimum 1 log. The filter reinjection water had the over all highest baseline ATP concentrations at 6 and 7 log ATP (pg/mL) for Biocide a and B, respectively.
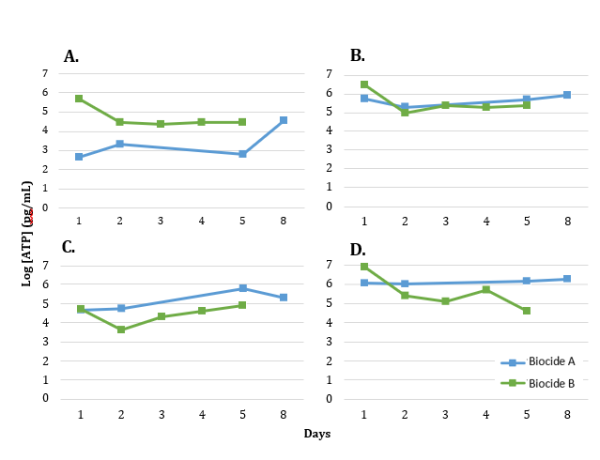
FIGURE 2: LOG ATP CONCENTRATION OVER TIME FOR NOVEMBER 2022 AND APRIL 2023 BIOCIDE TRIALS AT SAMPLING LOCATIONS (A) WELL OUTLET, (B) ARRIVAL, (C) SEPARATOR, AND (D) REINJECTION WATER. BOICIDE WAS APPLIED AFTER THE DAY 1 SAMPLES WERE TAKEN AND MEASURED. BIOCIDE A WAS APPLIED A SECOND TIME AT DAY 3.
QUANTITATIVE PCR (QPCR)
Eight qPCR assays for universal and MIC-related targets were run at all samples. To focus analysis, the results for only Total Prokaryote (TP), Sulfate-Reducing Bacteria (SRB), Methanogens (Meth), and micH over time in response to Biocide A and B application are shown in Figure 3. Generally, Biocide B qPCR values in log number of cells mL-1 were below those of Biocide A for TP, SRB, Meth, and micH with a maximum difference of 5.5 log TP cells mL-1 at day 5 in the Arrival sample. Also, for both Biocide A and Biocide B trials, the Separator and Reinjection water samples were highest in log cells mL-1 compared to the Outlet and Arrival samples. The Biocide B batch treatment samples from the Separator and Reinjection water showed an impact on the TP, SRB and Meth qPCR results between days 2 and 4. The Biocide A batch treatment samples from the same sample locations showed minimal impact on these three targets. The micH gene target was not detected in any sample.
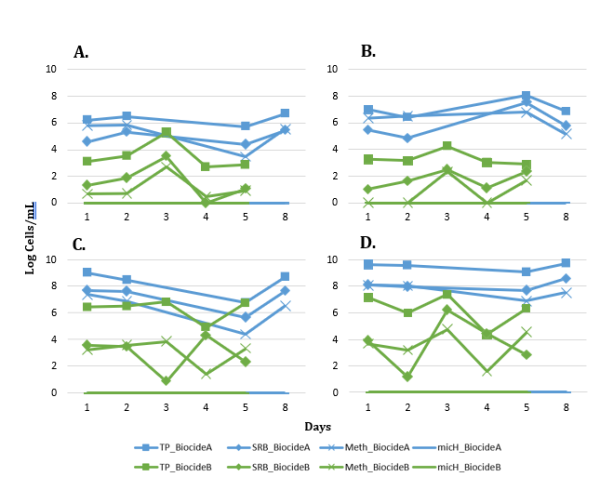
FIGURE 3: QPCR RESULTS FOR TOTAL PROKARYOTE (TP), SULFATE REDUCING BACTERIA (SRB), TOTAL METHANOGENS (METH), AND CORROSIVE METHANOGENS (MICH) FOR EACH SAMPLING LOCATION OVER TIME REPORTED IN LOG NUMBER OF CELLS/ML. SAMPLING LOCATIONS ARE SHOWN (A) WELL OUTLET, (B) ARRIVAL, (C) SEPARATOR, AND (D) REINJECTION WATER.
NEXT GENERATION SEQUENCING
Microbial Community Analysis was performed by sequencing of the 16S rRNA gene using next generation sequencing (NGS). Figure 4 shows nonmetric multidimensional scaling plots where each data point represents the microbial community in one sample. The distance between data points corresponds to the dissimilarity between samples determined by Bray-Curtis Dissimilarity distances. Figure 4 (A) demonstrates that the microbial communities cluster based on sampling location, and that the outlet and arrival samples cluster separately from the separator and reinjection water samples. Though the Biocide A trial had fewer NGS samples, those that were sequenced cluster closely to Biocide B. Figure 4 (B) demonstrates the change in microbial community over time after Biocide B was applied. There is no clear trend in Bray Curtis dissimilarity based on time after biocide application.
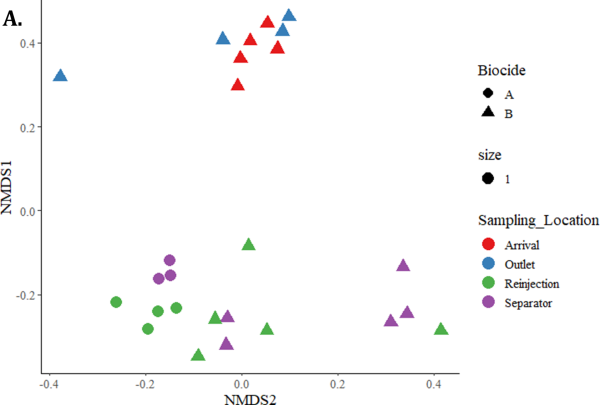
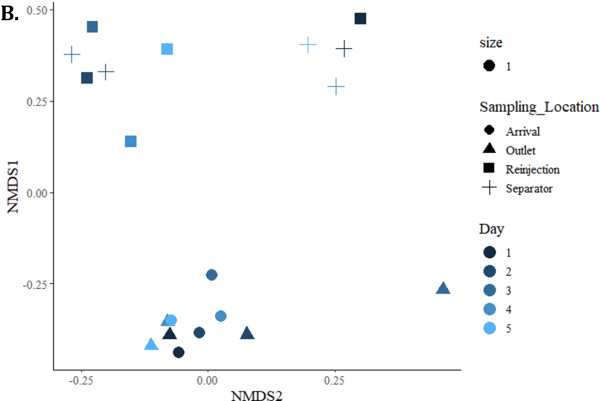
FIGURE 4: NON-METRIC MULTIDIMENSIONAL SCALING (NMDS) PLOTS WHERE EACH DATA POINT REPRESENTS THE MICROBIAL COMMUNITY IN A SAMPLE. THE DISTANCES WERE CALCULATED USING BRAY CURTIS DISSIMILARITY. (A) DEMONSTRATES THE DISSIMILARITY BASED ON BIOCIDE AND SAMPLING LOCATION. (B) DEMONSTRATES THE DISSIMILARITY BETWEEN BIOCIDE B SAMPLES BASED ON DAY. BIOCIDE B WAS APPLIED AFTER DAY 1 SAMPLE WAS PRESERVED.
Table 1 displays the relative abundance (%) between metabolic groups identified in a representative post-biocide treatment sample for each biocide trial. Taxa capable of sulfate-reduction are lower in relative abundance in Biocide B compared to A. Additionally, Biocide B communities had higher relative abundance of nitrate and nitrite -reducing taxa. The dominant sulfate-reducing taxa in the microbial communities from both Biocide A and B trials appearing in the top ten taxa for each, were Desulfonauticus (maximum relative abundance: 92.3% in Biocide A Arrival sample), Desulfovibrio (maximum relative abundance: 20.2% in Biocide B Separator sample), and Desulfobacter (maximum relative abundance: 44.0% in Biocide A Reinjection water sample).
TABLE 1: RELATIVE ABUNDANCE BY METABOLIC GROUPING FOR A REPRESENTATIVE SAMPLE FROM EACH LOCATION FOR BOTH BIOCIDE TRIALS. NOTE THAT THE SAMPLES WILL ADD TO >100% BECAUSE ONE TAXA CAN BE PLACED IN MULTIPLE METABOLIC GROUPINGS.
| Metabolic Grouping | Biocide A | Biocide B | |||||
| Arr | Sep | Reinj | Out | Arr | Sep | Reinj | |
| Total Prok qPCR (cells/mL) | 1.10E+08 | 2.98E+08 | 1.18E+09 | 1.95E+05 | 1.79E+04 | 6.54E+06 | 2.37E+07 |
| Acid-Producing | 27.48 30.74 | 33.71 29.98 | 16.41 16.65 | 34.57 | 37.42 | 34.05 | 22 |
| Fermentative | 0 | 0 | 24.96 | 20.19 | |||
| Hydrocarbon-Degrading | 20.36 | 13.71 | 11.01 | 40.95 | 39.47 | 22.94 | 16.41 |
| Iron-Oxidizing | 9.22 | 20.23 | 6.37 | 0.53 | 0.94 | 11.29 | 5.78 |
| Iron-Reducing | 18.45 | 13.94 | 9.8 | 34.57 | 34.32 | 22.83 | 16.18 |
| Methanogen | 1.33 | 0.46 | 0.49 | 0 | 0 | 0.3 | 0.13 |
| Nitrate-Reducing | 9.98 | 23.94 | 6.85 | 34.04 34.04 | 40.5 38.99 | 26.14 | 24.79 |
| Nitrite-Reducing | 0.19 | 0 | 0.24 | 10.73 | 15.4 | ||
| Slime-Forming | 13.63 | 27.2 | 17.38 | 39.89 | 39.93 | 38.96 | 29.85 |
| Sulfate-Reducing | 45.73 | 47.64 | 33.31 | 0.63 | 7.42 | 7.84 | 60.66 |
| Sulfur-Reducing | 28.44 | 35.57 | 17.15 | 57.44 | 63.15 | 47.29 | 39.69 |
DISCUSSION
In this field study, the microbial communities present at various sampling points along the process of a conventional onshore oil recovery site were characterized throughout two biocide trials. Biocide A and Biocide B were applied in batch treatments approximately 3 months apart. Though the biocide mode of action and some ancillary operational data cannot be shared, this study aims to share how three microbial monitoring tools can be used for understanding the impact of a biocide treatment, and also the risk of MIC present in an oil recovery operation.
The impact of Biocide A was monitored by testing for ATP concentration, qPCR for a variety of targets, and NGS across the four sampling points for one week. The ATP concentrations did not drop in the days following the batch treatments of Biocide A, remaining within the same order of magnitude for all four sampling locations indicating poor biocide efficacy for reducing microbial activity in the system (Figure 2). In a successful biocide treatment, microbial activity levels are expected to drop by 1 log pg ATP/mL or more [11]. qPCR assays for Total Prokaryote, SRB, and methanogens revealed a downward trend in cells/mL for the Separator samples over the days following treatment, however no other sampling locations had a substantial difference from the Day 1 pre-biocide treatment sample (Figure 3). In a successful biocide application, a decrease in the number of prokaryotic cells would be expected at more than one sampling location. In contrast to Biocide A, a noticeable drop in ATP was observed on Day 2 after Biocide B application at all sampling locations (Figure 2) suggesting efficacy of the biocide on decreasing microbial activity across the system. The qPCR results from the Biocide B application are quite variable but do show decreases in comparison to Biocide A, particularly in the Separator and Reinjection water samples (Figure 3) for TP, SRB and methanogens. In this case, qPCR was utilized to assess biocide efficacy by monitoring for universal gene targets (TP), and functional gene targets related to deleterious processes (SRB, methanogens) to ensure the biocide used is impacting these microorganisms of importance [2, 12]. The non-metric multidimensional scaling (NMDS) plots shown in Figure 4 indicated that the Biocide B did not drive a substantial change in the microbial community dynamics of the Outlet and Arrival samples where the data points clustered closely together. Biocide A did not have the same number of samples sequenced, however those that were clustered close to one another demonstrating similarity between samples and a low impact of biocide application. However, the data points for the Separator and Reinjection water samples are more distant, indicating more dissimilarity between samples and an impact from biocide application. This result agrees with the disruption seen in qPCR data in the Separator and Reinjection samples compared to that of the Outlet and Arrival samples. Overall, the samples clustered based on sampling location, agreeing with microbial community analysis in previous studies of different sampling points in oil recovery operations [4]. This analysis demonstrates how ATP, qPCR, and NGS can together provide an in depth understanding of the impact of a biocide application and insight into its efficacy.
These tools are valuable technologies not only for monitoring biocide efficacy, but also for assessing MIC risk in oil and gas systems. In this field study, a qPCR assay for the micH gene target was run on all samples. This gene target has been identified as a biomarker for corrosive methanogens, related to the large subunit of a nickel iron hydrogenase [13]. Though methanogens were identified via qPCR, micH was not found in any samples from this site (Figure 3). Given the presence of SRB identified by both qPCR and NGS, at this particular oil recovery site and the absence of micH in the methanogenic populations, MIC related to the activities of SRB is more likely than MIC related to methanogenic populations (Figure 3, Table 1). The metabolic groupings enriched in samples from this site including acid-producing and fermentative taxa, and sulfate/sulfur-reducing taxa, are related to the degradation of carbon steel by MIC (Table 1) [14, 15, 2, 16]. Microorganisms capable of acid-production ranged from 16.4% to 34.6% relative abundance and sulfur cycling (sulfate- and sulfur-reducing) microorganisms were maximally 63.2% dominant in the microbial communities from samples at this site. Three of the most abundance sulfate-reducing microorganisms, Desulfonauticus, Desulfovibrio, and Desulfobacter, have all been shown in previous studies to participate in MIC mechanisms [17, 18, 19]. The qPCR and NGS data suggests MIC and sulfide production risk from the enrichment of sulfate-reducing microorganisms in samples at this site.
CONCLUSIONS
In this field study, ATP, qPCR and NGS were utilized to assess the efficacy of two biocide trials and the risk of MIC. ATP, qPCR and NGS revealed higher efficacy of Biocide B as compared to Biocide A as it was associated with lower ATP concentrations, decreases in qPCR for MIC-related targets, and shifts in microbial community dynamics at two locations where the highest microbial activity was observed, the Separator and Reinjection water. Additionally, risk of MIC related to methanogens is unlikely due to the absence of the micH gene target, however an enrichment of sulfate-reducing microorganisms as determined by qPCR and NGS suggests MIC risk associated with sulfide production or electrical MIC (EMIC) activities of sulfate-reducing microorganisms [2]. This field study demonstrates the depth of information that can be obtained from the use of three culture-independent molecular microbiology methods that will ultimately be used by the operator to refine biocide programs and understand the risk of MIC present in this system.
ACKNOWLEDGMENTS
Thank you to the site operators for facilitating this field study.
References
| [1] | Gieg LM., Jack TR and Foght JM, Biological souring and mitigation in oil reservoirs, Applied Microbiology and Biotechnology, 92, (2011) 263-282. |
| [2] | Enning D and Garrelfs J, Corrosion of Iron by Sulfate-Reducing Bacteria: New Views of an Old Problem, Applied and Environmental Microbiology, 80(4) (2014). |
| [3] | Loto, CA, Microbiological corrosion: mechanism, control and impact—a review, The International Journal of Advanced Manufacturing Technology, 92 (2017) 4241-4252. |
| [4] | Nicoletti D, Sharma M and Gieg LM, Assessing Microbial Corrosion Risk on Offshore Crude Oil Production Topsides under Conditions of Nitrate and Nitrite Treatment for Souring, Microorganisms, 10(932) (2022). |
| [5] | Vigneron A, Head IM and Tsesmetzis N, Damage to offshore production facilities by corrosive microbial biofilms, Applied Microbiology and Biotechnology, 102 (2018) 2525-2533. |
| [6] | NACE INTERNATIONAL TM0194-2014 Standard Test Method: Field Monitoring of Bacterial Growth in Oil and Gas Systems. |
| [7] | ASTM D7687-17, Standard Test Method for Measurement of Cellular Adenosine Triphosphate in Fuel and Fuel-associated Water With Sample Concentration by Filtration. |
| [8] | Ben-Dov E, Brenner A and Kushmaro A, Quantification of sulfate-reducing bacteria in industrial wastewater, by real-time polymerase chain reaction (PCR) using dsrA and apsA genes, Microbial Ecology, 54(3) (2007) 439-451. |
| [9] | Steinberg LM and Regan JM, mcrA-Targeted Real-Time Quantitative PCR Method To Examine Methanogen Communities, Applied Environmental Microbiology, 75(13) (2009) 4435-4442. |
| [10] | Machuca Suarez L and Salgar-Chaparro S, Effect of Sample Storage Conditions on the Molecular Assessment of MIC, (In) Corrosion & Prevention, 2018, Adelaide, SA. |
| [11] | Corrin E, Leong S and Whalen PA, Comparison of Biocides Using a New, (In) International Symposium on Applied Microbiology and Molecular Biology in Oil Systems (ISMOS-2), 2009, Aarhus, DNK. |
| [12] | Venzlaff H, Enning D, Srinivasan J, Mayrhofer KJ, Hassel AW, Widdel F and Stratmann M, Accelerated cathodic reaction in microbial corrosion of iron due to direct electron uptake by sulfate-reducing bacteria, Corrosion Science, 66 (2013) 88-96. |
| [13] | Lahme S, Mand J, Longwell J, Smith R and Enning D, Severe Corrosion of Carbon Steel in Oil Field Produced Water Can Be Linked to Methanogenic Archaea Containing a Special Type of [NiFe] Hydrogenase, Applied Environmental Microbiology, 87(3) (2021). |
| [14] | Mand J, Park HS, Jack TR and Voordouw G, The role of acetogens in microbially influenced corrosion of steel, Frontiers in Microbiology, 5 (2014). |
| [15] | Gu T, Theoretical Modeling of the Possibility of Acid Producing Bacteria Causing Fast PItting Biocorrosion, Journal of Microbial & Biochemical Technology, 6(2) (2014). |
| [16] | Vigneron A, Alsop EB, Chambers B, Lomans BP, Head IM and Tsesmetzis N, Complementary Microorganisms in Highly Corrosive Biofilms from an Offshore Oil Production Facility, Applied Environemtnal Microbiology, 82(8) (2016) 2545-2554. |
| [17] | Dutra J, Gomes R, Garcia GJY, Romero-Cale DX, Cardoso MS, Waldow V, Groposo C, Akamine RN, Sousa M, Figueiredo H, Azevedo V and Goes-Neto A, Corrosion-influencing microorganisms in petroliferous regions on a global scale: systematic review, analysis, and scientific synthesis of 16S amplicon metagenomic studies, PeerJ Life and Environment, 11 (2023). |
| [18] | Chatterjee M, Fan Y, Jones AA, Pilloni G and Zhang X, Proteomic study of Desulfovibrio ferrophilus IS5 reveals overexpressed extracellular multi-heme cytochrome associated with severe microbiologically influenced corrosion, Scientific Reports, 11 (2021). |
| [19] | Li X, Duan J, Xiao H, Li Y, Liu H, Guan Y and Zhai X, Analysis of Bacterial Community Composition of Corroded Steel Immersed in Sanya and Xiamen Seawaters in China via Method of Illumina MiSeq Sequencing, Frontiers in Microbiology, 8 (2017) 1737. |
AUTHOR DETAILS
 | D. Nicoletti is the corresponding author of this paper. She is an Applications Scientist at LuminUltra Technologies Ltd., a position she has held since 2021. She is responsible for product applications in industrial sectors with particular focus in oil and gas microbiology. She has research experience in MIC, souring, bioremediation, and other oilfield microbial processes and is an active member of industry associations AMPP and IATA. |
 | J-Y SOULARD : Sales Engineer at LuminUltra Technologies for Europe since 2015. Graduate in Chemical Engineering with over 30 years experience in Water Treatment, Pulp & Paper, Microbiology for several Speciality Chemicals suppliers dedicated to industrial applications. |
 | Dr. Jordan Schmidt is the Senior Director of Technology & Innovation at LuminUltra Technologies. He holds a PhD in Civil Engineering from Dalhousie University in Halifax, Canada. Originally trained in biological wastewater treatment, Dr. Schmidt has 10+ years of experience working on the monitoring of microorganisms in industrial water systems. |
 | A.Kokolekos has over 12 years experience in the roles of service, sales, applications and product management to the industrial and municipal market segments in the microbial monitoring industry. He is an active member of the Australasian Corrosion Association Oil & Gas Technical Group. |